Pythonで箱ひげ図を表示するには、matplotlibのmatplotlib.pyplot.boxplotやseabornのseaborn.boxplotを使う。
matplotlib.pyplot.boxplotの使い方
matplotlib.pyplot.boxplotの引数に、Numpyのndarray配列やpandasのDataframeを指定すれば、箱ひげ図を表示することができる。
import numpy as np
import matplotlib.pyplot as plt
import seaborn as sns

# Numpy ndarray配列
a = np.array([0, 1, 2, 3, 4, 5, 5, 6, 11, 13, 4, 5, 6, 1, 1, 20])
# pandas Dataframeの読み込み
df = sns.load_dataset('tips')
display(df)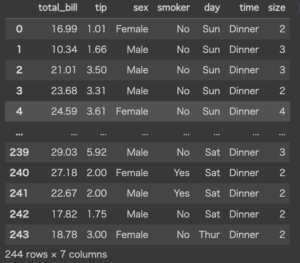
plt.boxplot(a)
plt.show()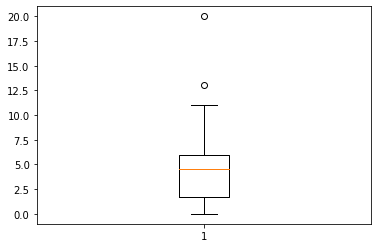
plt.boxplot(df['total_bill'])
plt.show()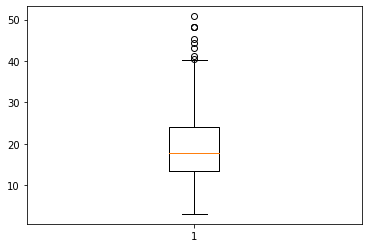
seaborn.boxplotの使い方
seaborn.boxplotの引数yにndarray配列を指定すると、箱ひげ図を表示できる。
sns.boxplot(y=a)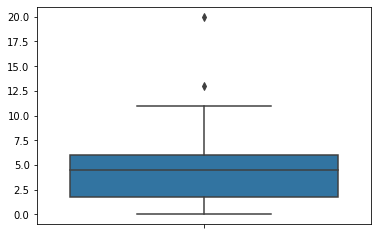
pandasのDataFrameの場合は、引数yにcolumns(列ラベル)、引数dataにDataFrameを指定する。
sns.boxplot(y='total_bill', data=df)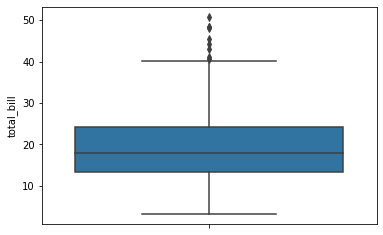
引数xにcolumns(列ラベル)を指定することで、列ラベルごとの箱ひげ図を表示することもできる。
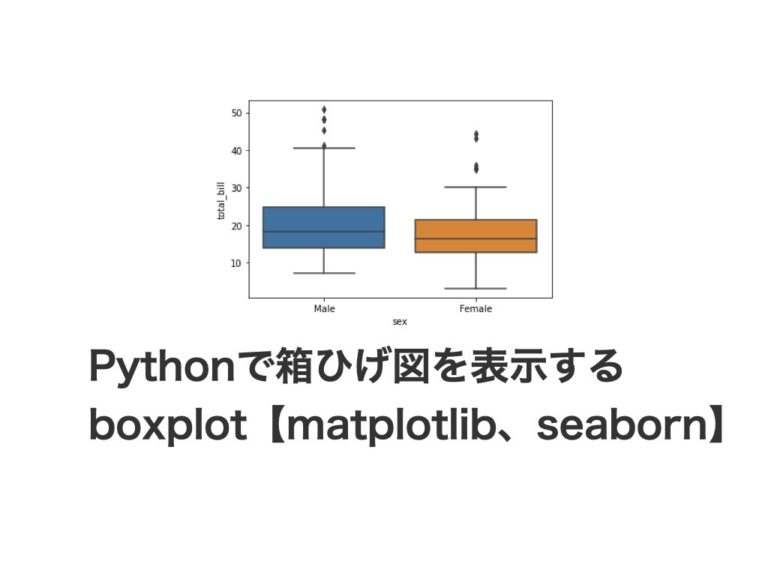
sns.boxplot(x='sex', y='total_bill', data=df)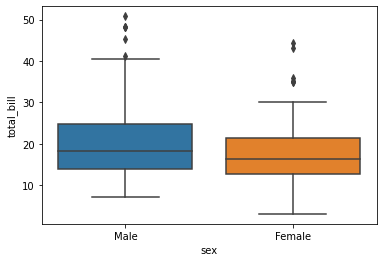
コメント